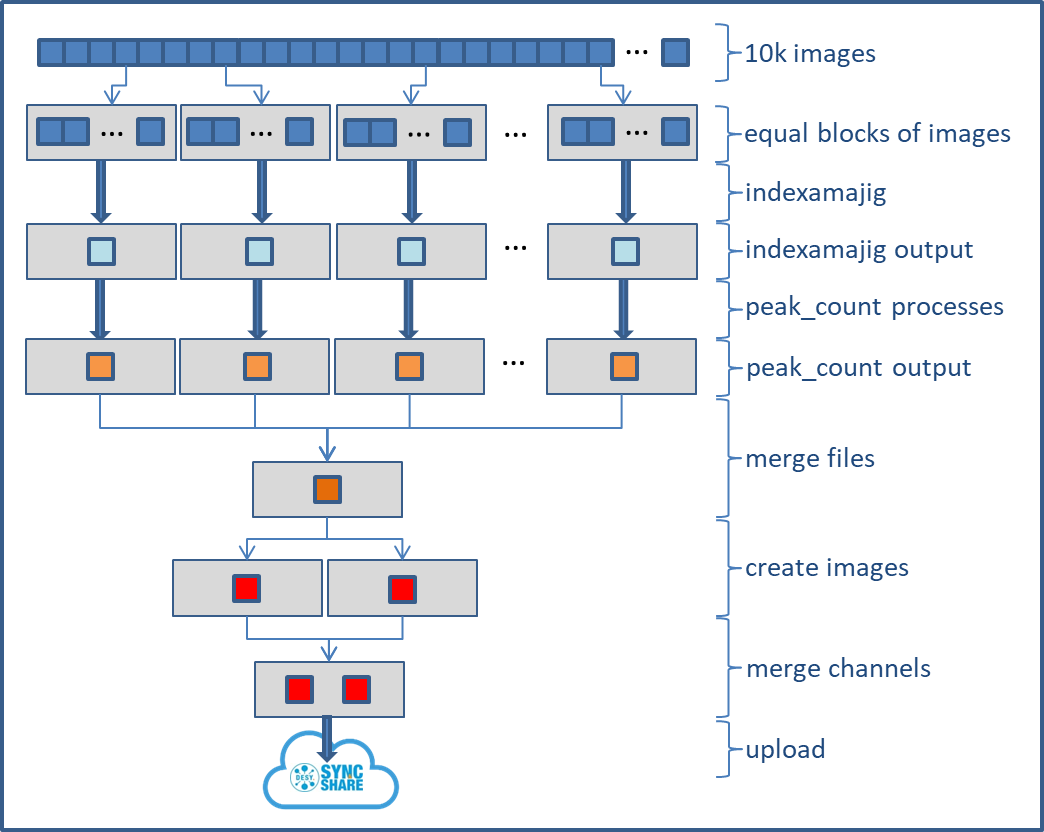
Tp provide a primitive example for swift data processing, I used crystfel offline processing in it's most simple form. For this particular case, I selected roughly 10k images from cxidb, split the set of images into bunches of roughly equal size, and distribute the jobs as slurm jobs on the cluster. swift takes care of the orchestration of the job submission, so you don't have to work with complicated constructs of job-arrays and dependencies.

The sample aims to illustrate very few of swift features. The image gives a rough idea of the workflow.

Content


The job submission script

A sample submission script could look like this:

swift job submission script
#!/bin/bash
#SBATCH --time=0-08:00:00
#SBATCH --nodes=1
#SBATCH --partition=upex
#SBATCH --job-name=swift-split
#SBATCH --dependency=singleton
#SBATCH --output=swift-split-58.out
#SBATCH --tasks-per-node=1
#SBATCH --constraint=Gold-6240
export LD_PRELOAD=""

source /etc/profile.d/modules.sh
module load maxwell swift
basedir=/beegfs/desy/user/schluenz/Crystfel.Swift
export PATH=$basedir:$PATH
export SBATCH_CONSTRAINT=Gold-6240
export SBATCH_TIMELIMIT=02:00:00

numnodes=58

mkdir -p $basedir/procdir
start=`date +%s`
startdate=`date`

ls -1 /beegfs/desy/group/it/ReferenceData/cxidb/ID-21/cxidb-21-run01[34]*/data1/LCLS*.h5 > $basedir/procdir/files.to.process 
num_images=$(ls -1 /beegfs/desy/group/it/ReferenceData/cxidb/ID-21/cxidb-21-run01[34]*/data1/LCLS*.h5 | wc -l)

splitlines=$(( $(cat $basedir/procdir/files.to.process |  wc -l) / $numnodes  ))
/usr/bin/split -l $splitlines -d $basedir/procdir/files.to.process $basedir/procdir/xxx
#export TURBINE_SBATCH_ARGS="--constraint=Gold-6240"
swift -sites upex -config maxwell.conf indexamajig.swift -nsplit=$numnodes 

enddate=`date`
end=`date +%s`
runtime=$((end-start))

cat <<EOF

Summary:
------------------------------------------------------------------------------------------------------
JOB.............: $SLURM_JOB_NAME
JobID...........: $SLURM_JOB_ID
Partition.......: $SLURM_JOB_PARTITION
Nodes...........: $numnodes
Start...........: $startdate
End.............: $enddate
Time............: $runtime
Number of Images: $num_images
URL.............: 

------------------------------------------------------------------------------------------------------

EOF


In detail

The first part of the submission script just sets the environment. Please note that the "base job" allocates only a single node!

environment
#!/bin/bash
#SBATCH --time=0-01:00:00
# you need just a single node, kind of a master which orchestrates the jobs
#SBATCH --nodes=1
#SBATCH --partition=upex
#SBATCH --job-name=swift-split
#SBATCH --dependency=singleton
# I've chosen a name which reflects the number of nodes (58) to use
#SBATCH --output=swift-split-58.out
#SBATCH --tasks-per-node=1
# that's just to ensure that all jobs run on identical nodes for benchmarking
#SBATCH --constraint=Gold-6240

# the basic setup
export LD_PRELOAD=""

source /etc/profile.d/modules.sh
module load maxwell swift

The rest is the preparation of the input file, and running the actual workflow:

preparation & environment
# it's easier to embed individual tasks into small scripts, and it's easier to have those in the PATH
basedir=/beegfs/desy/user/schluenz/Crystfel.Swift
export PATH=$basedir:$PATH
# pass constraints and limits to slurm. It's also possible to declare those in the site config:
export SBATCH_CONSTRAINT=Gold-6240
export SBATCH_TIMELIMIT=02:00:00

# use 58 nodes, so split the list of images into 58 roughly equal parts
numnodes=58
mkdir -p $basedir/procdir

# collect a list of images and count them
ls -1 /beegfs/desy/group/it/ReferenceData/cxidb/ID-21/cxidb-21-run01[34]*/data1/LCLS*.h5 > $basedir/procdir/files.to.process 
num_images=$(ls -1 /beegfs/desy/group/it/ReferenceData/cxidb/ID-21/cxidb-21-run01[34]*/data1/LCLS*.h5 | wc -l)

# split the files
splitlines=$(( $(cat $basedir/procdir/files.to.process |  wc -l) / $numnodes  ))
/usr/bin/split -l $splitlines -d $basedir/procdir/files.to.process $basedir/procdir/xxx

# run the workflow
swift -sites upex -config maxwell.conf indexamajig.swift -nsplit=$numnodes 


the workflow
type file;

# this generates just a list of images for each of the 58 parts and puts them into new set of files. There are simpler ways of doing that...
# splitter is the name of the scriplet. Note: you can't have '.' in your filename!
app (file o) split (int i, int nsplit) 
{
   splitter i nsplit stdout=filename(o);
}

# actually run indexamajig. 
app (file o) indexamajig (int i) 
{
   indexamajigwrap i stdout=filename(o);
}

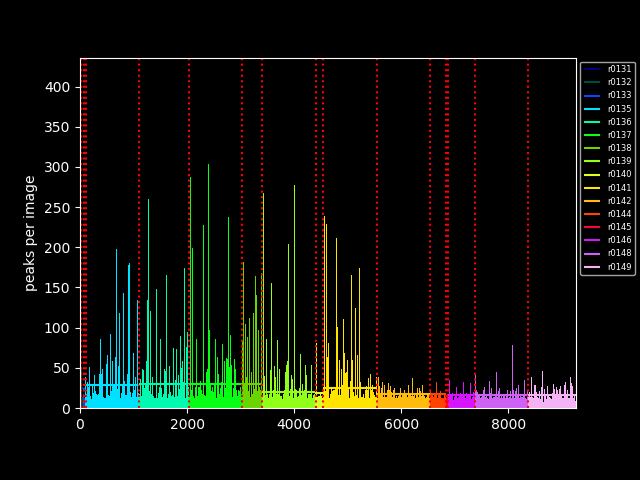
# collect information about number of peaks per image
app (file o) peak_count (file infile) 
{
   peak_count filename(infile) stdout=filename(o);
}

# ... and create a plot for peak counts
app (file o, file image)  plot_peaks (file infile) 
{
   plot_peaks filename(infile) filename(image) stdout=filename(o);
}

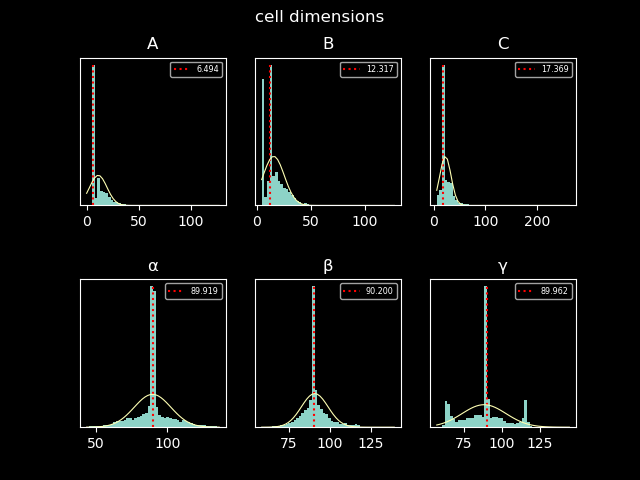
# ... and cell dimension
app (file o, file image)  plot_cell (file infile) 
{
   plot_cell filename(infile) filename(image) stdout=filename(o);
}

# merge all peak information into a single file
app (file o) merge_peaks (file s[])
{
  cat filenames(s) stdout=filename(o);
}

# if nsplit is not declared on the command line default to 16 nodes
int nsplit = toInt(arg("nsplit","16"));

file image_list[];
file peaks[];

foreach i in [0:nsplit-1] {
  file splitout <single_file_mapper; file=strcat("output/split_",i,".out")>;
  file indexamajigout <single_file_mapper; file=strcat("output/indexamajig_",i,".out")>;
  file peak_countout <single_file_mapper; file=strcat("output/peak_count_",i,".out")>;

# create the lists of images
  splitout = split(i, nsplit);
  image_list[i] = splitout;

# process all sets of images. Though it looks serial it's actually done in parallel
  indexamajigout = indexamajig(i);
# get number of peaks from indexamajib processing. With indexamajigout being the output of indexamajig and input for peak_counting, swift will schedule the job only when indexamajig is done.
  peak_countout = peak_count(indexamajigout);
  peaks[i] = peak_countout;
}

# combine the peak counting stats into a single file
file all_peaks <single_file_mapper; file=strcat("output/peaks.out")>;
all_peaks = merge_peaks(peaks);

# create two plots. again that's actually processed in parallel.
file cimage <"/beegfs/desy/user/schluenz/Crystfel.Swift/output/cells.png">;
file pimage <"/beegfs/desy/user/schluenz/Crystfel.Swift/output/peaks.png">;

file pp <single_file_mapper; file=strcat("output/pp.out")>;
file pc <single_file_mapper; file=strcat("output/pc.out")>;
(pc,cimage)=plot_cell(all_peaks);
(pp,pimage)=plot_peaks(all_peaks);
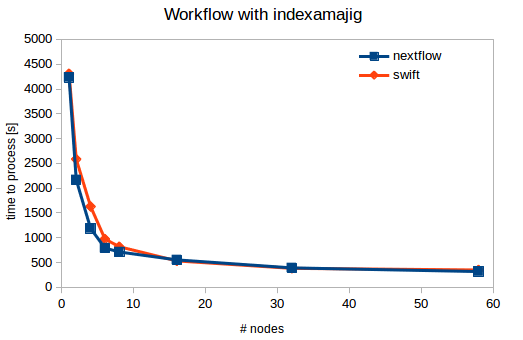

Results

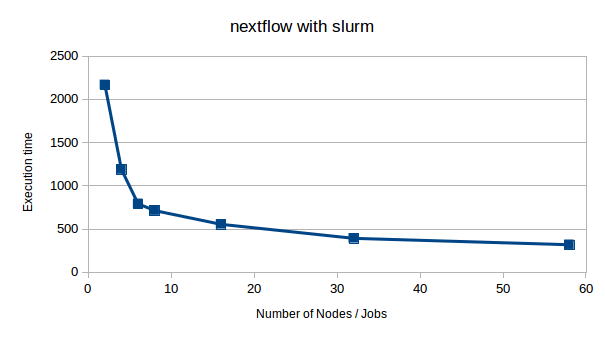
The scriplet above where used to run simple benchmarks. Execution of the code was done for various number of nodes in a single run, ranging from 1 to 58 concurrent jobs and nodes. Scaling is far from linear, but always also quite a bit of concurrent i/o which is presumably the limiting factor. The time to process the 9280 images can be reduced to about 300s, or 0.03s per image. Peak counting and plotting don't contribute significantly to execution times.

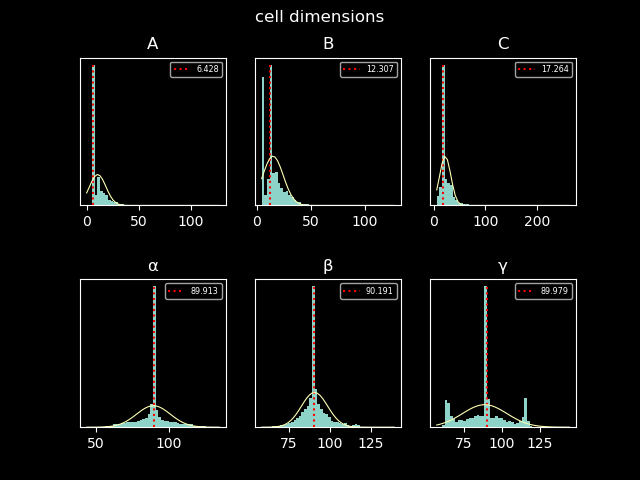
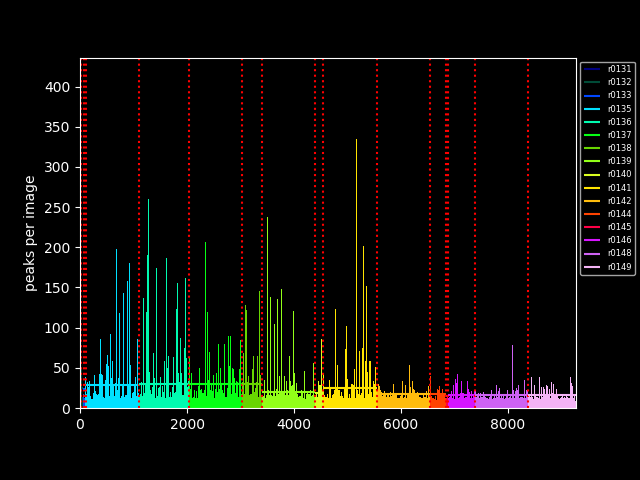
Just for sake of completeness, the two plot generated as part of the workflow:


Additional files

peak_count.sh
#!/bin/bash
x=$1

images=$(grep "Image file" $x  | awk '{print $3}' | rev | cut -d"/" -f1 | rev )
extract=$(egrep 'num_peaks|Image f|Cell|lattice|centering' $x )

for image in $images ; do
    z=$(echo "$extract" | sed -n "/$image/,/Image f/p"  ) 
    npeaks=$( echo "$z" | grep num_peaks | awk '{print $3}')
    filename=$image
    cell=$( echo "$z" | grep "Cell parameters" | awk '{print $3, $4, $5, $7, $8, $9 }' )
    centering=$( echo "$z" | grep centering | awk '{print $3}' )
    lattice=$( echo "$z" | grep lattice_type | awk '{print $3}' )
    if [[ "x$cell" == "x" ]]; then
	cell="0.00 0.00 0.00 0.00 0.00 0.00"
	centering="0"
	lattice="0"
    fi
    if [[ "x$filename" != "x" ]]; then
	run=$(echo $filename | cut -d_ -f4)
	imgno=$(echo $filename | cut -d_ -f5,6 | cut -d. -f1 )
	echo "$filename $run $imgno $npeaks $cell $centering $lattice "
    fi
done

exit

The python plots were just for my entertainment, don't take it seriously!

plot.peaks.py
#!/usr/bin/python3
import matplotlib as mpl
mpl.use('Agg')
import matplotlib.pyplot as plt
import numpy as np
from cycler import cycler
import sys

try:
    infile = sys.argv[1]
except:
    print(' Provide an input file')
    exit()

npeaks=[]
run=[]
srun=[]

n=0
lineList = [line.rstrip('\n').split() for line in open(infile)]
lineList.sort()
for line in lineList:
    if len(line) > 1:
        this_run=line[1]
        if n==0:
            run.append(this_run)
            srun.append(0)
        elif this_run != run[-1]:
            run.append(this_run)
            srun.append(n)

        npeaks.append(int(line[3]))
        n=n+1

srun.append(n)

colormap = plt.cm.gist_ncar
colors = [colormap(i) for i in np.linspace(0, 1,len(srun))]

plt.style.use('dark_background')
plt.ylabel("peaks per image")
plt.margins(0.2)
plt.subplots_adjust(bottom=0.15)
plt.xlim(left=0)
plt.xlim(right=len(npeaks))

for i in range(len(srun)-1):
    x = np.arange(srun[i],srun[i+1])
    plt.bar(x, npeaks[srun[i]:srun[i+1]], width=1., color=colors[i]) 
    plt.vlines(srun[i]+0.6,0,max(npeaks)+20,linestyles='dotted',colors='r',label='')
    plt.hlines(np.median(npeaks[srun[i]:srun[i+1]]),srun[i],srun[i+1]-1,colors=colors[i],linestyles='solid',label=run[i])

plt.ylim(top=max(npeaks)+20)
plt.legend(loc='upper left', prop={'size':6}, bbox_to_anchor=(1,1))

plt.gcf().savefig('peaks.png')

plot.cell.py
#!/usr/bin/python3
import matplotlib as mpl
mpl.use('Agg')
import scipy.stats
import matplotlib.pyplot as plt
import numpy as np
import sys

try:
    infile = sys.argv[1]
except:
    print(' Provide an input file')
    exit()

run=[]
srun=[]


n=0
lineList = [line.rstrip('\n').split() for line in open(infile)]
lineList.sort()
cell=[]
ctmp=[]*6

for line in lineList:
    if float(line[4]) > 0.0:
        ctmp=[float(i) for i in line[4:10]]
        cell.append(ctmp)
        n=n+1

x = np.linspace(0, 2 * np.pi, 400)
y = np.sin(x ** 2)

cells = np.array(cell)

plt.style.use('dark_background')

fig, axs = plt.subplots(2, 3)
fig.suptitle('cell dimensions')

axs[0, 0].set_title('A')
axs[0, 1].set_title('B')
axs[0, 2].set_title('C')
axs[1, 0].set_title(r'$\alpha$')
axs[1, 1].set_title(r'$\beta$')
axs[1, 2].set_title(r'$\gamma$')

for ax in axs.flat:
    ax.yaxis.set_major_locator(plt.NullLocator())

for i in range(3):
    n, bins, patches = axs[0, i].hist(cells[:,i], 50, density=1)
    (mu, sigma) = scipy.stats.norm.fit(cells[:,i])
    y = scipy.stats.norm.pdf(bins, mu, sigma)
    l = axs[0,i].plot(bins,y,linewidth=0.8)
    median = np.median(cells[:,i])
    textstr = "{:.3f}".format(median)
    axs[0,i].vlines(median,0,max(n),colors='r',linestyles='dotted',label=textstr)
    axs[0,i].legend(prop={'size': 'xx-small'})

    n, bins, patches = axs[1, i].hist(cells[: , i+3], 50, density=1)
    (mu, sigma) = scipy.stats.norm.fit(cells[: , i+3])
    y = scipy.stats.norm.pdf( bins, mu, sigma)
    l = axs[1, i].plot(bins, y, linewidth=0.8)
    median = np.median(cells[:,i+3])
    textstr = "{:.3f}".format(median)
    axs[1, i].vlines(median,0,max(n),colors='r',linestyles='dotted',label=textstr)
    axs[1,i].legend(prop={'size': 'xx-small'})


plt.subplots_adjust(hspace=0.5)

fig.savefig('cells.png')


Attachments:

cells.png (image/png)
peaks.png (image/png)
nextflow-split-load.png (image/png)
nextflow-2.png (image/png)
nextflow-1.png (image/png)
nextflow.png (image/png)
nextflow (application/gliffy+json)
swift.cells.png (image/png)
swift.peaks.png (image/png)
nextflow-swift.png (image/png)