Disclaimer: very naive approach. Can certainly be done much better (for example with real-life tests with asapo). Might nevertheless give a very rough idea.
Summary
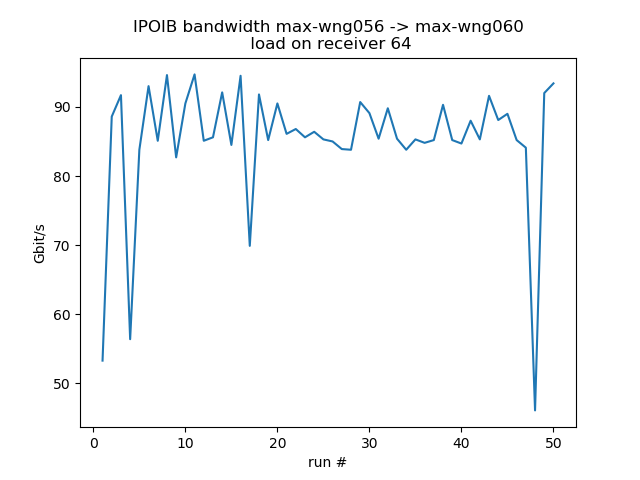
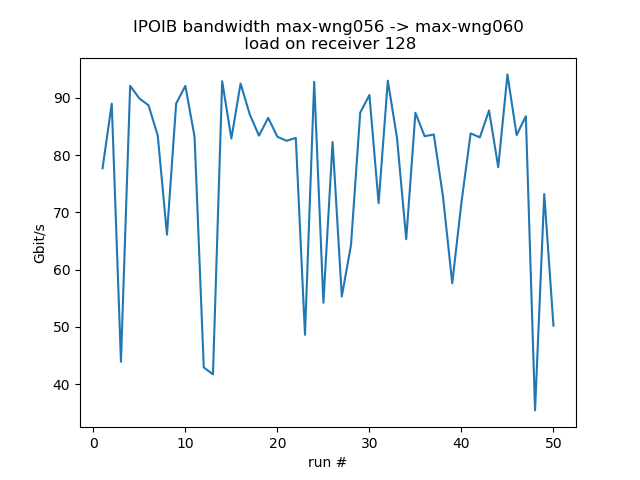
- IPOIB bandwidth is rather susceptible to load on receiver, aggregated loss is about 30%
- with all physical cores busy the bandwidth is about 40Gb/s and only when using multiple streams (8-16)
- 5Gib/s is the most to expect under such conditions for server/receiver with 100Gb/s HDR connections
- a larger number of concurrent streams doesn't help (at best)
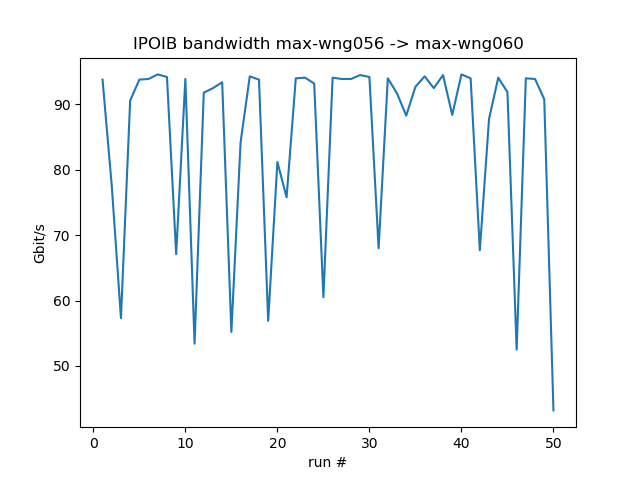
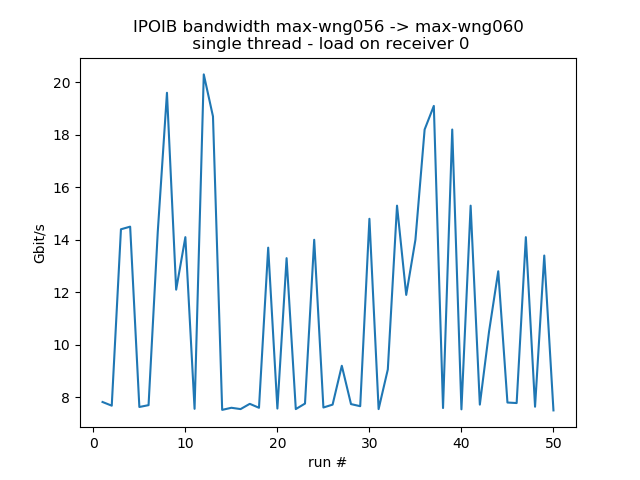
- IPOIB bandwidth varies a lot and is also quite susceptible to "unrelated" cross-traffic
- RMDA speed seems largely unaffected by CPU load or other factors
Configuration 1
3 hosts on 2 different switches and different capabilities
| sender | receiver 1 | receiver 2 | |
|---|---|---|---|
| hostname | max-wn113 | max-wn112 | max-wn064/65 |
| CPU1 | dual AMD EPYC 75F3 32-core | dual AMD EPYC 75F3 32-core | dual AMD EPYC 7402 24-Core |
| Cores /Threads2 | 64 (128HT) | 64 (128HT) | 48 (96HT) |
| IB devices3 | ConnectX-6 | ConnectX-6 | ConnectX-6 |
| IB Speed4 | 100 Gb/sec | 100 Gb/sec | 100 Gb/sec |
| PCI-E5 | PCI-E Gen4 | PCI-E Gen4 | PCI-E Gen3 |
| IPOIB6 | max-wn113-ib | max-wn112-ib | max-wn064-ib |
| IPOIB MTU6 | 2044 | 2044 | 2044 |
| IB switch | max-ib-l308 | max-ib-l308 | max-ib-l303 |
1: lshw -C cpu 2: lscpu | egrep 'Model name|Socket|Thread|NUMA|CPU\(s\)' 3: lspci | grep -i mell 4: ibstatus 5: as root: /usr/sbin/dmidecode | grep PCI, /usr/sbin/lspci -vv | grep -E 'PCI bridge|LnkCap' 6: ifconfig ib | |||
Configuration 2
3 hosts on 2 different switches and 9dentical capabilities
| sender | receiver 1 | receiver 2 | |
|---|---|---|---|
| hostname | max-wng056 | max-wng058 | max-wng060 |
| CPU | AMD EPYC 7543 32-Core | AMD EPYC 7543 32-Core | AMD EPYC 7543 32-Core |
| Cores /Threads | 64 (128HT) | 64 (128HT) | 96 (192HT) |
| IB devices | ConnectX-6 | ConnectX-6 | ConnectX-6 |
| IB Speed | 100 Gb/sec | 100 Gb/sec | 100 Gb/sec |
| PCI-E | PCI-E Gen4 | PCI-E Gen4 | PCI-E Gen4 |
| IPOIB | max-wng056-ib | max-wng058-ib | max-wn060-ib |
| IPOIB MTU | 2044 | 2044 | 2044 |
| IB switch | max-ib-l308 | max-ib-l308 | max-ib-l306 |
Testing TCP bandwidth with IPOIB
test is simply using iperf:
- start iperf on server: iperf -s
- start iperf on client: iperf -c max-wn112-ib -t 60 -i 5 -f g -P <number of threads)
| host / number of threads | P=1 Gbit/s | 2 | 4 | 8 | 16 | 32 |
|---|---|---|---|---|---|---|
| max-wn112 | 24.1 | 23.3 (§) | 42.2 | 90.5 (%) | 83.7 | 66.1 |
| max-wn064 | 19.1 | 25.3 (§) | 15.9 (§) | 21.3 (§) | 23.8 | 26.3 |
(§) varies a lot. Bandwidth sometime not even 30% of value listed (%) connect failed: Operation now in progress Remarks: cpu load on sender is low. cpu load on receiver is 1.0*number_of_threads | ||||||
Do the same test with max-wn065 as sender and max-wn064 as receiver. These two are sitting on the same switch like max-wn112/3, but have PCI-Gen3 and less powerful CPUs
| host / number of threads | P=1 | 2 | 4 | 8 | 16 |
|---|---|---|---|---|---|
| max-wn064 | 18.6 | 15.9 | 16.3 | 18.2 | 16.2 |
Numbers are very volatile and can easily vary by a factor of two between different runs of exactly identical commands.
Do the same test with max-wng056 as sender and max-wng058/60 as receiver
Identical to configuration 2, just different hosts (due to availability)
| host / number of threads | P=1 | 2 | 4 | 8 | 16 | 32 |
|---|---|---|---|---|---|---|
| max-wng058 | 21.4 | 26.2 | 33.6 | 71.0 | 81.4 | 77.0 |
| max-wng060 | 14.0 | 26.1 | 41.5 | 80.2 | 83.9 | 77.4 |
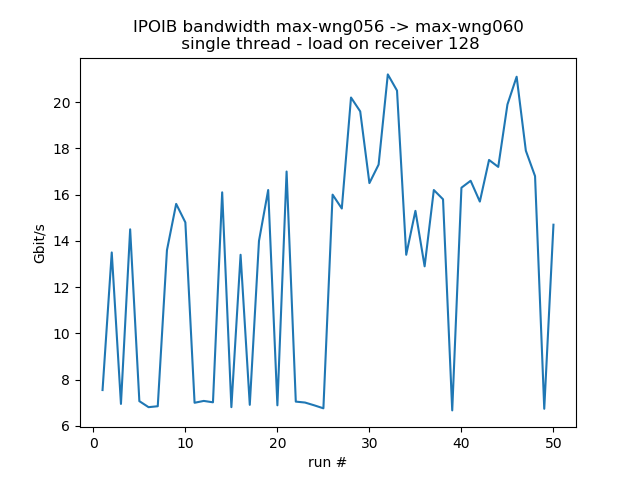
Variability of IPOIB bandwidth for 50 consecutive runs with 8 resp. 1 concurrent threads
CPU load on receiver
Test the behavior when the receiver is under some stress. For the fast receiver (max-wn112) the loss is about 20% for moderate stress, 46% for very high stress.
- set number of iperf threads to 8
- create load with stress-ng --cpu <ncores>
| load=0 | load=8 | load=16 | load=32 | load=64 | load=# cores | |
|---|---|---|---|---|---|---|
| max-wn112 | 90.5 | 78.8 (%) | 70.0 | 73.0 (%) | 72.8 | 48.4 |
| max-wn064 | 21.3 | 27.9 | 19.3 | 25.7 (%) | 25.2 | 18.7 |
| (%) connect failed: Operation now in progress | ||||||
Concurrent sends from 4 different hosts
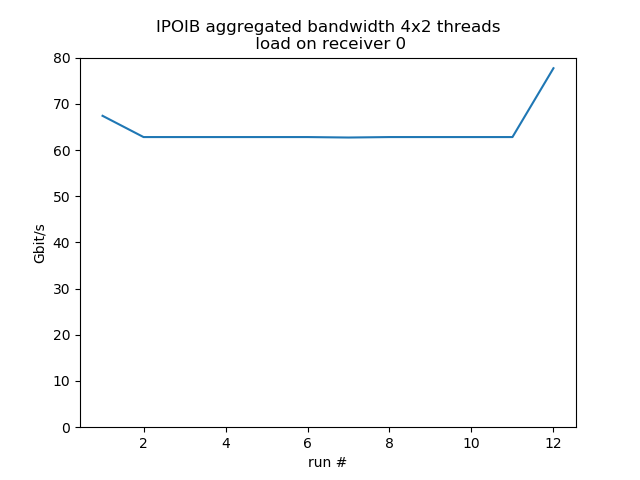
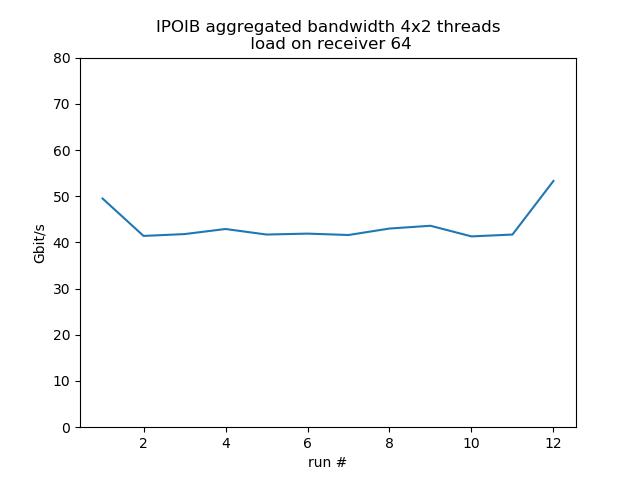
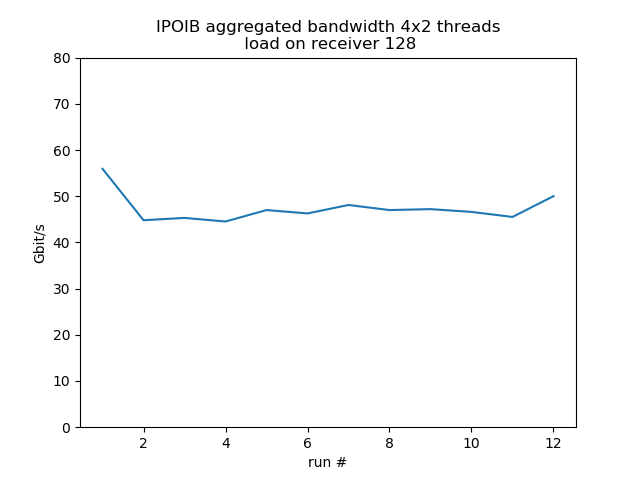
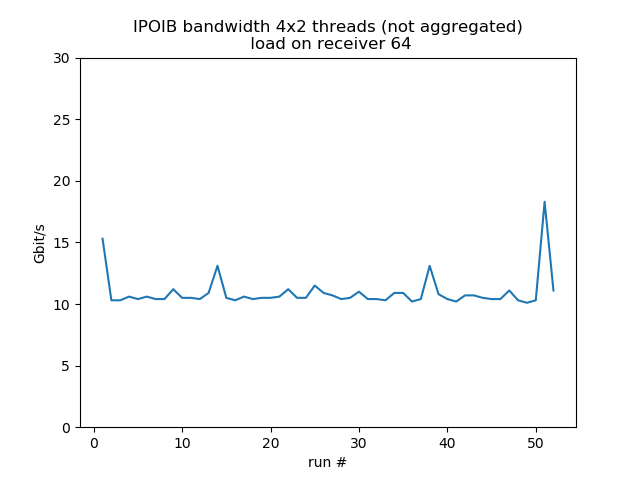
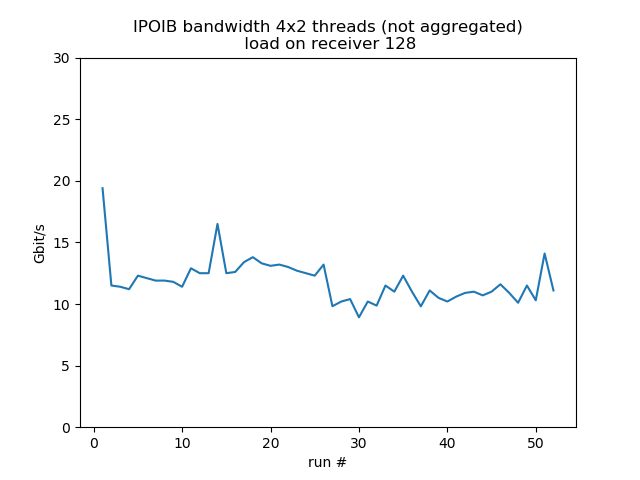
Test run with 4 senders with 2 concurrent threads each, 1 receiver listening on 4 different ports, so it's fairly equivalent to 8 concurrent threads. Behavior is much more smooth. Load on the receiver reduces bandwidth by about 30%.
load 0: aggregated average bandwidth: 64.4 Gbit/s | load 64: aggregated average bandwidth: 43.6 Gbit/s | load 128: aggregated average bandwidth: 47.3 Gbit/s |
Testing bandwidth with RDMA
test is simply using iperf to "stream data".
- start receiver: ib_write_bw -F --report_gbits -a -d mlx5_0
- start sender: ib_write_bw -F --report_gbits -a <receiver>
| load=0 | load=8 | load=16 | load=32 | load=64 | load=# cores | |
|---|---|---|---|---|---|---|
| max-wn112 | 98.74 | 98.75 | 98.72 | 98.74 | 98.53 | 98.60 |
| max-wn064 | 98.74 | 98.76 | 98.65 | 98.75 | 98.74 | 98.75 |
The bandwidth is always close to the limit and doesn't seem to be affected by CPU capabilities, or load on the receiver, or location in the IB network.
