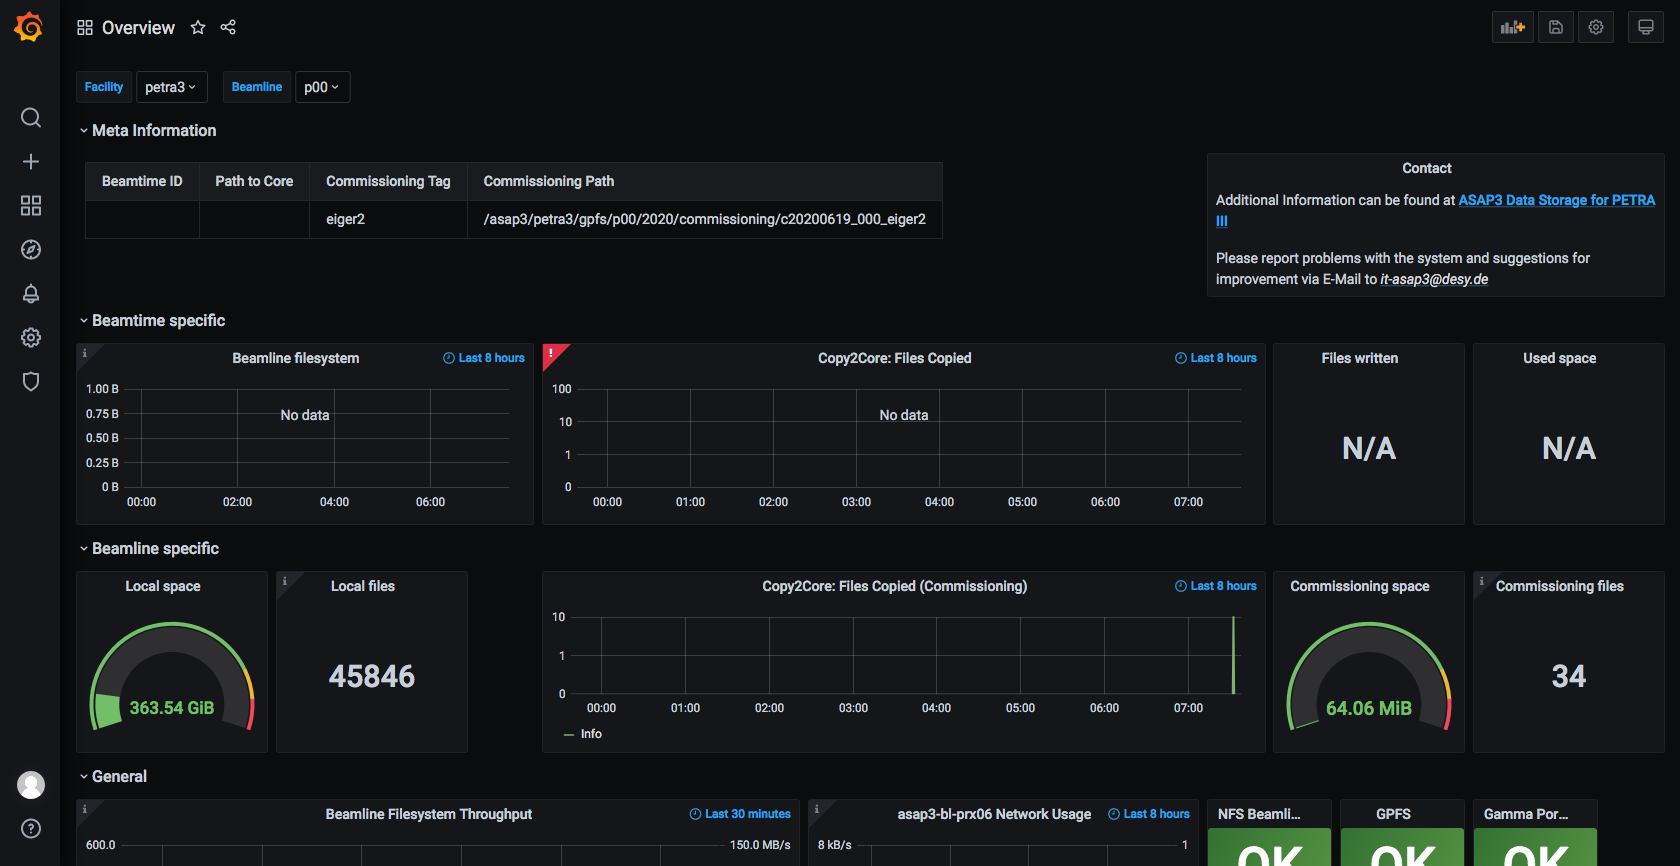
In order to get a quick overview of the current resource consumption and service availability, a Grafana monitoring dashboard is available:
Grafana Dashboard
URL: https://asap3-monitoring.desy.de/d/eTnwpN0ik
Note: only reachable from DESY internal network
Dashboard Sections
The dashboard is seperated into 4 sections:
- Meta information
- Beamtime specific
- Beamline specific
- General
See below for a more detailed explanation of the individual graphs.
Meta Information
From left to right:
- Basic information of the current running beamtime and commissioning run
Beamtime Specific
Beamtime specific storage consumption and information about fast copy process for the current beamtime.
From left to right:
- Beamline filesystem: Storage usage over the last 8 hours
- Copy2Core: Displays the number of copied files from beamline- to core filesystem of the fast copy process
- Files written/used space: Numerical storage consumption of the current beamtime on the beamline filesystem
Beamline Specific
Beamline specific storage consumption and information about fast copy process for the current commissioning run.
From left to right:
- Local space/files: Storage consumption for the beamline specific /local folder
- Copy2Core: Displays the number of copied files from beamline- to core filesystem of the fast copy process
- Commissioning space/files: Storage consumption and number of files for the current commissioning run
General
The area includes general information, which are not directly related to the current beamtime or beamline.
Multiple beamlines are sharing storage resources!
From left to right:
- Beamline Filesystem Throughput, specific for a given server of the beamline
- Read and write throughput to GPFS in MiB/s to the beamline filesystem
- Input/Output operations per second (IOPS) to the beamline filesystem
- Network Usage, specific for a given server of the beamline
- Network throughput in bytes for send and receive, usually MiB/s or GiB/s
- Counter for transmission (txerrors) and receive (rxerrors) errors of the network card
- Status Box
- Lists the state for several services, can be one of the following 4 states
- OK: Everything is up and running
- WARNING: Parts of the service are degraded, e.g. due to loss of redundancy.
- CRITICAL: Service is unavailable
- UNKNOWN: No monitoring result available for the given timestamp. Does not imply a service interruption.
- Lists the state for several services, can be one of the following 4 states
- Beamline filesystem (overall usage)
- Overall used space of the beamline filesystem over the last 8 hours
- Recent information
- Text box for reminders about future maintenances or current troubles


